CPI Infographic Data Change Automation
An automation tool that updates recurring CPI infographic templates by reading Excel data, updating Photoshop PSD text layers, exporting outputs, and uploading files to Google Drive.
Practical Impact
Reduced monthly infographic production from around 1 hour to a few minutes and improved recurring data-change accuracy to 100% by reducing manual copy-paste errors.
The Problem
The office produces around 4 CPI infographics per month with the same layout but different data. Manual Photoshop editing, file naming, exporting, and uploading usually took around 1 hour and often needed corrections after supervisor review.
The Solution
Built an automation workflow that reads source Excel data, updates matching Photoshop PSD text layers, exports PNG and PDF files, applies proper file naming, and uploads outputs to assigned Google Drive folders.
My Role
Designed the Photoshop template structure, mapped the monthly data-change process, built the automation with AI-assisted development, and tested outputs against source workbooks.
Tools & Technologies
Key Features
- Excel data reading
- Photoshop text-layer updating
- PNG and PDF export
- Automated file naming
- Google Drive folder upload
- Recurring monthly workflow support
Workflow Improvement
Reduced manual editing, copy-paste checking, exporting, naming, and uploading steps.
System Views
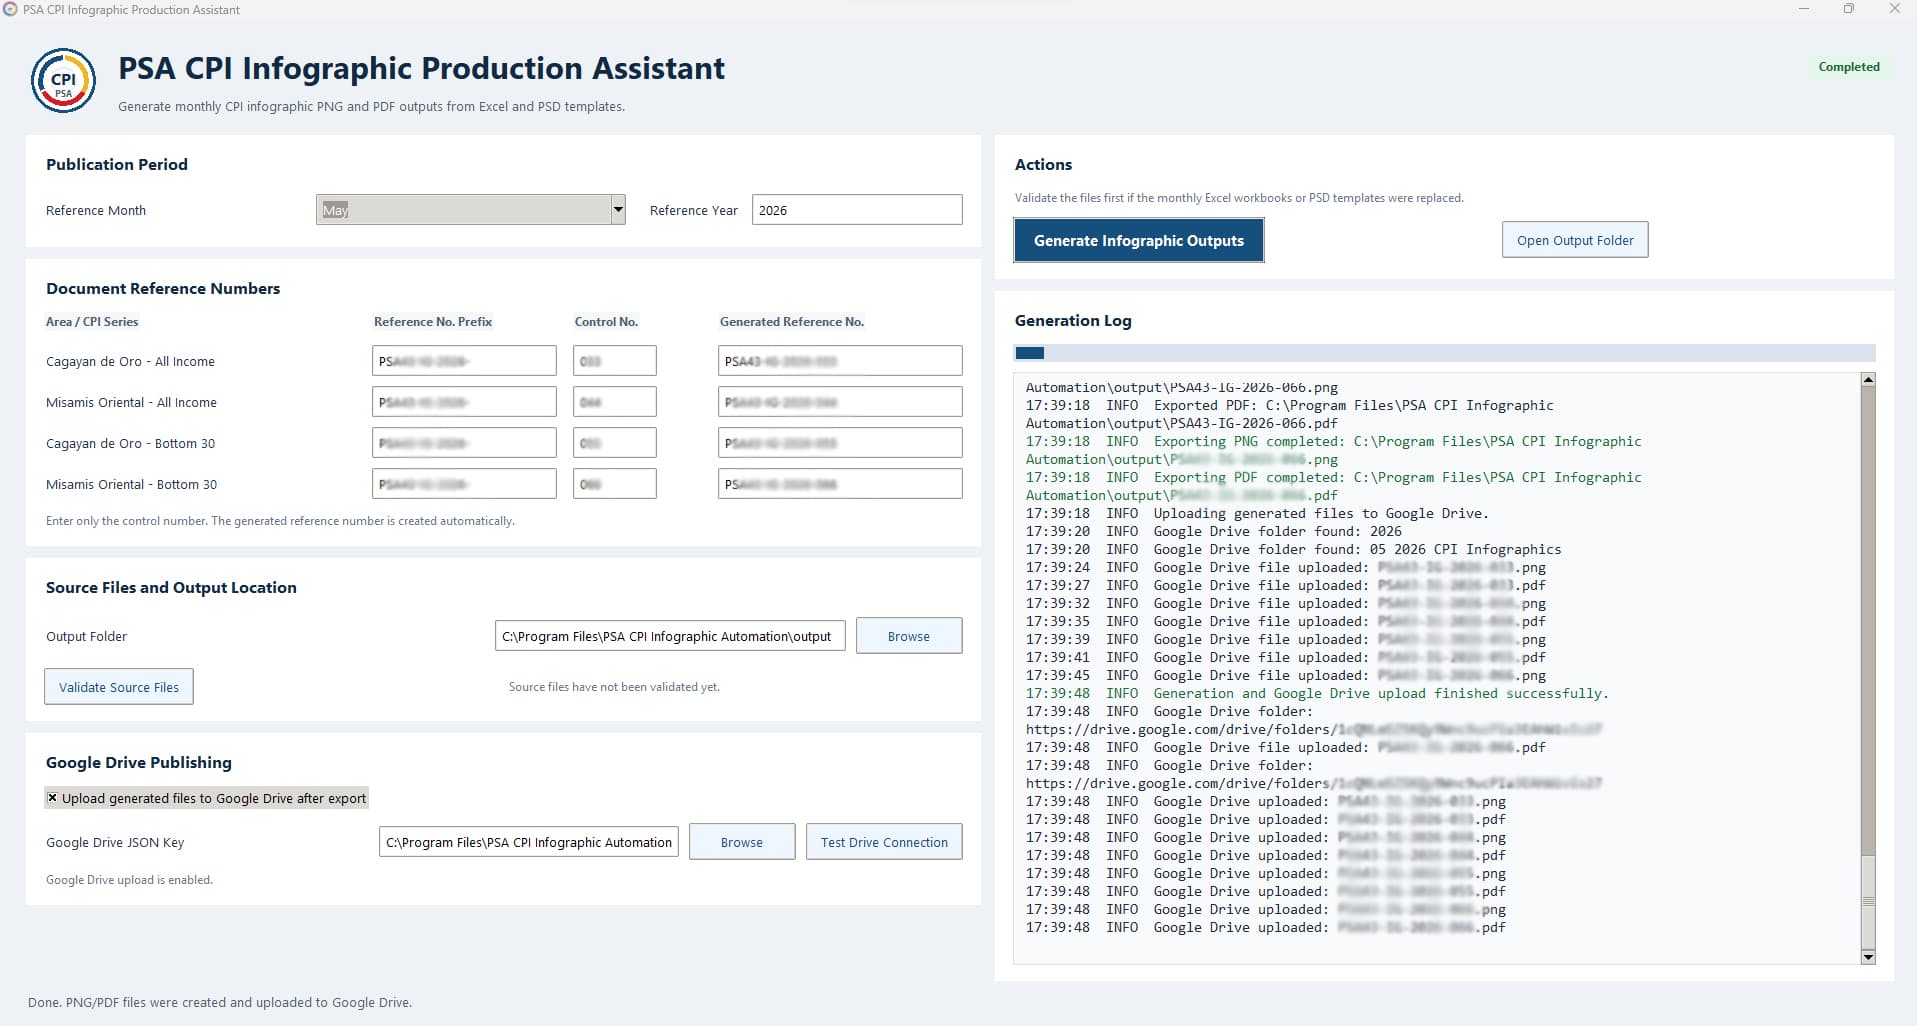
CPI Infographic Generator UI
Excel-to-PSD workflow diagram
Export folder screenshot with censored file details
Lessons Learned
Template consistency makes automation easier. The more predictable the source file and PSD layers are, the faster and safer the monthly update process becomes.
Interested in how I built this?
I am open to remote Technical VA, IT Support VA and AI-assisted workflow automation roles.